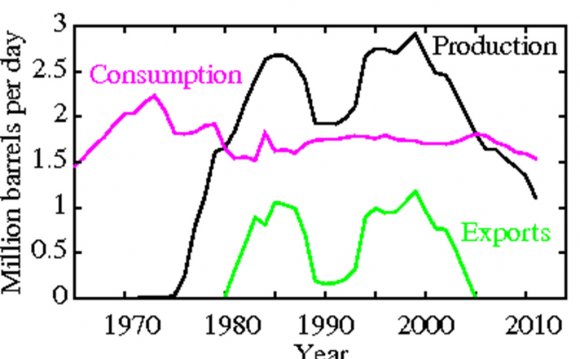
Figure 1 In the period 1999 to 2008, sharply rising oil price more than outweighed plummeting production and the total value of that production kept rising. But with oil price now stabilised and range bound $100-$120 / barrel, a continued fall in production will begin to drag the value of that production downwards as capital and operating costs go up. Data from the BP statistical review of World Energy 2013. Click on all charts to get a larger copy.
Oil Field Decline and Decline Rates
Production from most oil fields begins to decline within a few years of production starting as a result of pressure depletion and reserves depletion and ingress of water or gas into the previously oil bearing strata. During the early years of a basin development new discoveries that come on line will normally more than compensate for decline and production may grow. However, as new discovery rate falls and the number of new fields coming on line goes down, decline takes over and can be difficult to reverse.
UK oil production peaked in 1999 and has since declined at an annual rate between 5 and 10% (Figure 2). However, in 2011 decline accelerated to an unprecedented 17.9%. A number of factors contribute to this (Figure 2) including an increase in taxation on North Sea production made without warning in March of that year.
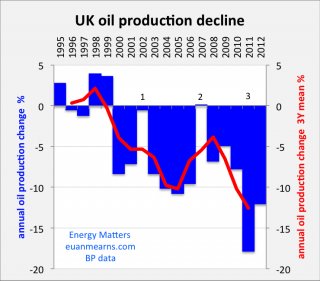
Figure 2 Annual decline rates based on data displayed in Figure 1. Occasional major new field developments such as Elgin/Franklin in 2001/02 (1) and Buzzard in 2007/08 (2) arrested declines for only 1 year. Major unscheduled field outages in ageing infrastructure (Schiehallion periodically 2009-2013; Elgin, Franklin and Shearwater in 2012) have contributed to accelerating decline. And a spate of helicopter accidents, some fatal, in the period 2009-2013, has disrupted production. A greater industry focus on health and safety following the Macondo blow out in the Gulf of Mexico has also made an impact. An increase in North Sea production taxation announced in March 2011 added fiscal uncertainty, and certainly did no help (3).
Capital and Operating Costs
The decline of UK North Sea oil has continued unabated despite record high oil price and investment. Capital expenditure on new field developments and old field refurbishments has grown from £5.2 billion in 2008 to a projected £14 billion this year (Figure 3; data from DECC). Some of the new production from this CAPEX will begin to flow in the years ahead.
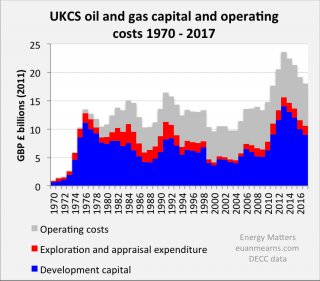
Figure 3 Field development capital, exploration and appraisal and operating costs for the UK continental shelf, historic and projected (UK Department of Energy and Climate Change – DECC). 2013 will see record expenditure despite oil and gas production continuing its free fall.
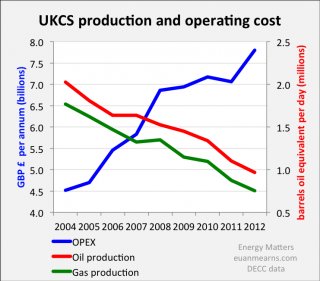
Of greater concern for the industry is spiralling operating costs. Total OPEX for oil and gas has near doubled from £4.5 billion in 2004 to £7.8 billion in 2012 whilst in the same period both oil and gas production have more than halved (Figure 4; data from DECC). These diminishing returns can clearly not continue for ever.
Figure 4 Plunging production and spiralling costs spells trouble ahead for the UK oil and gas industry. OPEX from DECC, oil and gas production from BP. One billion cubic feet of gas (bcf) = 0.19 million barrels of oil equivalent. Note that chart is not zero scaled.
Impact on Balance of Trade
UK oil production got seriously under way in 1976 and grew strongly for a decade having a profound impact upon the UK’s export / import balance in energy. For 20 years, the UK enjoyed a surplus in oil (and gas) production providing energy security and a positive contribution to the balance of trade (Figures 5 and 6).
Figure 5 The new DECC energy portal is a gold mine of UK energy statistics such as the history of oil and oil products imports and exports shown here. Prior to and during World War II (WWII) the UK lacked significant refining capacity and depended upon imported refined products. Post WWII imports of crude oil ballooned presumably matched by expansion of refining capacity. With the advent of North Sea oil production in the 1970s the UK became an exporter of crude oil and some refined products until 2006 when we once again became a net importer.
 With the onset of decline post 2000 the UK oil and gas surplus has been eaten away and since 2005 energy imports have once again become the norm and the UK trade balance in energy is spiralling into the red (Figure 6). An energy surplus of £9 billion in 2000 has turned into a deficit of £21 billion in 2012. Where UK energy security once lay at our door step in The North Sea we are now increasingly dependent upon energy imports from Norway, Russia, Africa and The Middle East.
Figure 6 This chart, kindly provided by DECC, shows the swing from £9 billion energy surplus to £21 billion energy deficit in only 12 years. To put this in context, the UK current account deficit for 2012 was £59.8 billion. About one third of this is down to spiralling energy imports. The government surely has a duty to manage this situation.
Globally, high energy prices have been caused by the passing of a peak in cheap conventional oil production in 2005-2008. New energy resources coming on stream such as shale oil and gas are very expensive to develop and produce. They are not cheap. The high cost of recovering the remainder of North Sea oil reserves is amply demonstrated by Figure 4. While energy prices are clearly a burden on society, high price is far better than energy scarcity or no energy at all. The UK government, misguided by over zealous attachment to market dogma and by Green advocacy has neglected the interests of the UK population by allowing, indeed encouraging, the demise of indigenous primary energy production. Whilst some renewable energy most certainly has a place in the energy mix, an energy policy based on the 2008 Climate Change act with a focus on CO2 reduction strategies completely misses the big picture of providing affordable and secure energy for all and protecting the best interests of the UK economy.
RELATED VIDEO


Share this Post
latest post
-
 North Sea Restaurant DC June 29, 2023
 -
 North Sea oil drilling May 30, 2023
 -
 North Sea Radio Orchestra April 30, 2023
 -
 Overfishing in the North Sea March 31, 2023
 -
 North Seas March 1, 2023
 -
 North Sea oil and gas jobs January 30, 2023
 -
 Offshore catering jobs North Sea December 31, 2022
 -
 Map of North Sea oil Platform December 1, 2022
 -
 North Sea Cycle Route November 1, 2022